A P&L tells you what happened; a CFO uses it to figure out why.
Most ABA practice owners already look at their profit and loss statement every month. Fewer have a reliable way to turn a number that looks off into an answer about what to actually do next.
Think of the P&L as the trunk of a tree. Every branch - clinical labor costs, utilization, cancellations, reimbursement rates, operating expenses, cash flow - eventually shows up somewhere on that statement.
The job of a CFO isn't to stare harder at the trunk. It's to know which branch to check first, and in what order, so a single number doesn't send you chasing the wrong fix.
This guide walks through that sequence: where to start, how to tell a real problem from a planned one, and why a profitable month on paper doesn't always mean cash in the bank.
Before diving in, three quick definitions:
What is a P&L statement?
A profit and loss statement (P&L), also called an income statement, summarizes a business's revenue and expenses over a defined period and shows whether the business generated a profit or a loss. For an ABA practice owner, the P&L is the starting point - the real value comes from what you do with it operationally, not from the bottom line alone.
What does ABA mean in this article?
ABA stands for applied behavior analysis. Throughout this guide, "ABA practice" refers to an independent provider organization delivering ABA therapy, where clinical staffing, utilization, cancellations, reimbursement, and payer collections directly shape financial performance.
What is gross margin?
Gross margin is gross profit expressed as a percentage of revenue. Before comparing your practice to any benchmark, it's worth defining exactly which direct clinical costs you're including - accounting classifications can differ meaningfully from one practice to the next.
Want to see if you’re leaving money on the table?
Get a free financial assessment from our healthcare accounting experts.
What Does an ABA Practice P&L Tell You?
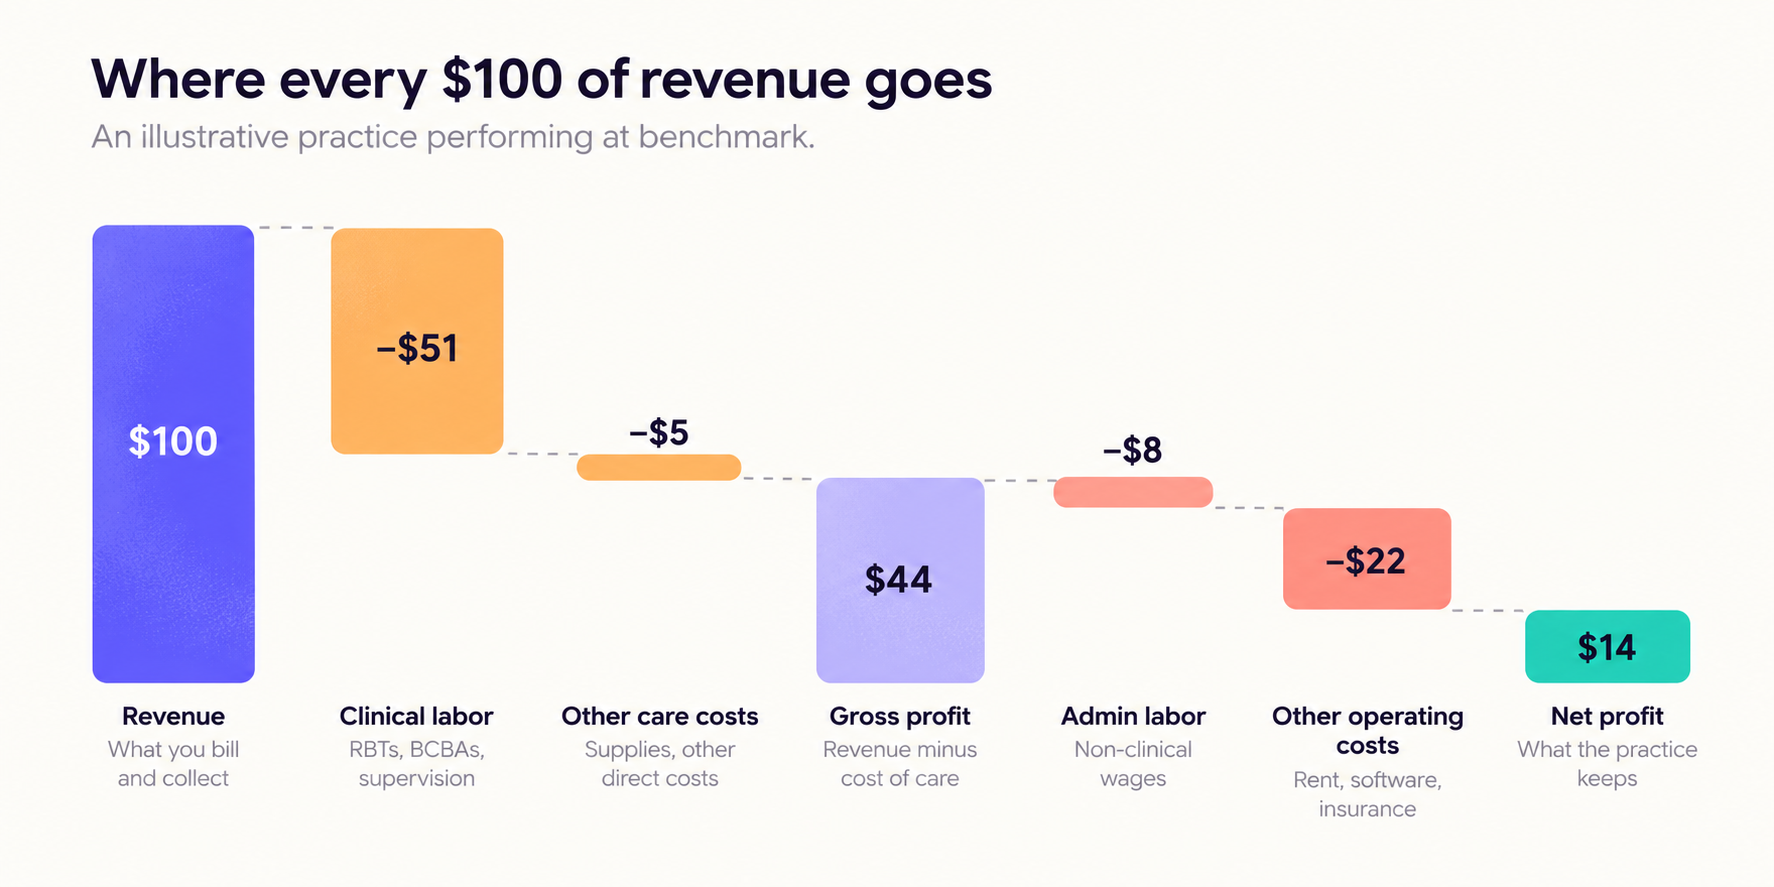
At a high level, an ABA practice P&L moves through a familiar sequence: revenue from billed sessions, direct clinical costs (BCBA, RBT, and BT pay), gross profit, operating expenses (administration, facilities, software, billing), and finally net profit or EBITDA. Most owners read it top to bottom, in the order it's laid out.
A CFO tends to read it in the opposite direction: starting at the margin lines and working backward to find what drove them.
That reordering matters, because it changes the first question you ask. "Did we make money this month?" is a different question than "Is our core clinical model working, and if not, where specifically is it breaking down?" The second question is the one that actually leads somewhere.
Gross Profit Margin vs. Net Profit Margin: What's the Difference?
Gross profit margin measures what's left after direct clinical costs - pay for the BCBAs, RBTs, and BTs actually delivering care - are subtracted from revenue.
Net profit margin goes further, subtracting every other cost of running the practice: rent, software, billing, admin staff, insurance, and everything else that isn't direct clinical labor.
The two numbers answer different questions.
Gross margin tells you whether your clinical delivery model is fundamentally priced and staffed correctly. Net margin tells you whether the whole business, overhead included, is sustainable.
A practice can have strong gross margin and weak net margin - a sign the problem sits in operating expenses, not clinical delivery - or the reverse. Knowing which one is off tells you where to look next, which is exactly the sequence the rest of this guide follows.
One classification note worth flagging early: how you count a BCBA's supervision time, or a lead RBT's mentoring hours, can shift costs between "clinical" and "administrative" depending on how your books are set up.
Before comparing your gross margin to any benchmark - including the ranges in Flychain's 2026 ABA Practice Financial Benchmark Report - confirm you're using a consistent definition of what counts as direct clinical cost.
Start With Gross Margin: Is Your Core Clinical Model Working?
Gross margin is the first number worth checking, because it isolates the part of the business closest to patient care: whether you're priced and staffed correctly for the therapy you deliver.
Flychain's 2026 ABA Practice Financial Benchmark Report lays out target ranges for gross margin and five other KPIs across a large sample of ABA practices. We won't recreate that table here, but if you haven't checked your own numbers against it, that's a useful step before reading further.
If your gross margin sits meaningfully below the benchmark range, work through two branches in order: clinical labor costs, then utilization and cancellations.
If Gross Margin Is Low, Look at Clinical Labor Costs First
Start with the cost side of the equation. A few questions worth asking:
- Does your BCBA-to-RBT ratio match what your caseload and authorization mix actually require, or are you carrying more supervision capacity than the caseload needs?
- Are your clinical pay rates in line with the local market, or meaningfully above it? Flychain's CFO Hub includes salary benchmarking that can show whether specific roles are running over- or under-market for your region.
- How much of your clinical payroll is going to unbillable time - training, drive time between locations, documentation - that never shows up as a billed unit?
- Are you relying on 1099 contractors at a premium rate where a W-2 hire would be more cost-effective at your current volume, or the reverse?
If labor costs look reasonable relative to the market and your caseload mix, the next branch to check is utilization.
Then Look at Utilization and Cancellations
Utilization measures how much of your available or scheduled clinical time actually converts into billed sessions.
Cancellations are one of the most common reasons utilization comes in below plan - and they're deceptive. This is because a cancellation often doesn't reduce your labor cost (staff are frequently still paid) while it does reduce the revenue that cost was supposed to generate.
That combination compresses gross margin from both directions at once.
Once you've ruled out labor costs and utilization as the driver, there's a third branch worth checking before you conclude the clinical model itself is broken: whether the practice is actually being reimbursed fairly for the units it does bill.
Then Ask Whether Reimbursement Rates Are the Real Problem
Everything so far has assumed your practice is collecting what it's owed on every claim it submits.
That's not always true, and it's worth ruling out before you restructure staffing or renegotiate anything internally.
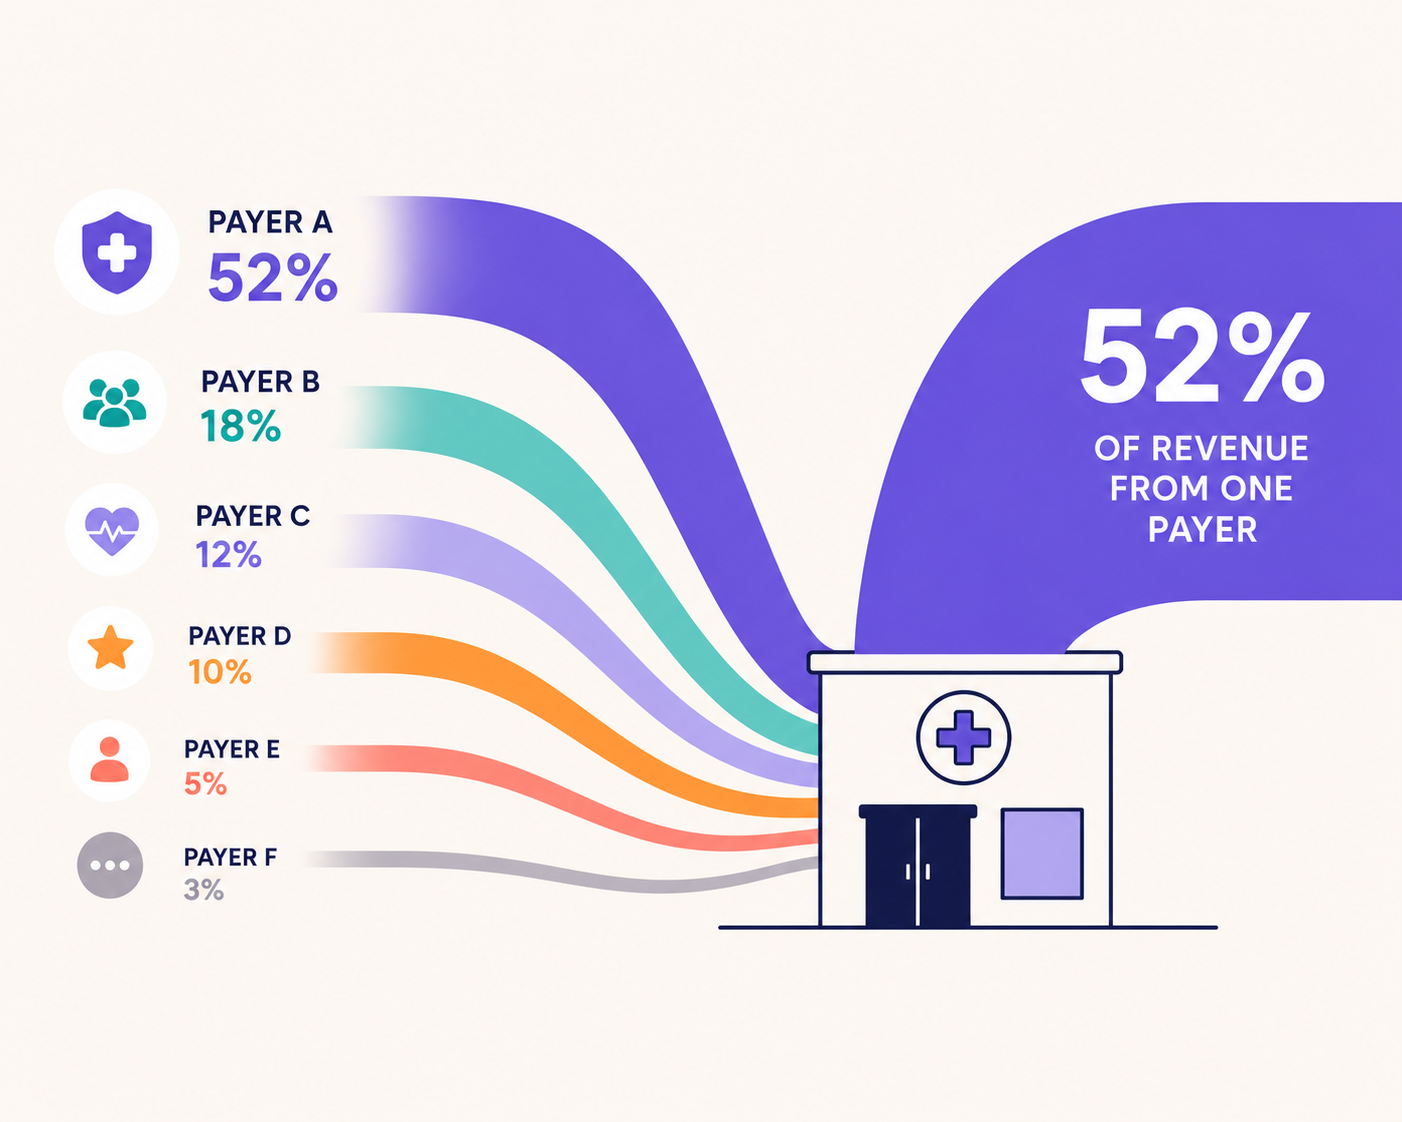
Almost a third of receivables need extra work that a standard denial-rate report won't show you.
The biggest drivers of that rework are mostly administrative, not clinical: documentation and information gaps account for close to 20% of denied dollars, followed by coverage issues and credentialing problems. In other words, the fix usually lives in intake and billing processes, not in how care is delivered.
The good news is that this is fixable with consistency. Across practices on Camber's platform, first-try claim success improved from 77% to 92% over two years, and most of that gain came from larger, multi-location practices standardizing how every location handles documentation and billing. Enterprise practices moved from 53.2% to 84% success, a 31-point jump.
Once a practice reaches a consistent process, ongoing rework rates converge across practice sizes regardless of scale.
Rework also isn't evenly distributed across payers. Medicaid fee-for-service programs showed the highest rework rates by volume, and by payer type, Medicaid FFS ran roughly twice the rework rate of Medicaid managed care and commercial payers.
Geography compounds this: practices in the lowest-reimbursement states saw rework rates more than double those in the highest-reimbursement states.
And rates themselves vary more than most owners expect, well before a claim is even submitted. Within the same payer, region, and credential modifier, Flychain's own analysis of UnitedHealthcare-family Transparency in Coverage filings found a 47% gap between the lowest and highest rate paid for the same ABA code. Roughly 64% of practices analyzed were sitting at the payer's default floor rate, never having negotiated above it.
For the full breakdown of claims rework, payer-type differences, and what's actually driving reimbursement variance, see Camber's companion article on claims and reimbursement economics.
If you want to check where your own contracted rates sit for a specific payer and region, Flychain's Free Downloads page publishes a new contracted-rate benchmark for a different payer and state every week, or you can run your own numbers directly with the Contracted Rate Analysis Tool for ABA to see whether you're sitting at the floor or above it.
If Gross Margin Is Healthy, Look at Operating Expenses
If gross margin is in a healthy range, the clinical delivery model is doing its job, but that doesn't mean the rest of the P&L is telling a clean story. The next place to look is operating expenses: everything below the gross profit line.
The instinct when an expense line jumps is to start cutting. A CFO's instinct is to ask why the number moved before deciding whether it's actually a problem.
A common pattern: a practice's general and administrative (G&A) costs spike in a single month not because spending genuinely increased, but because a regional director's compensation got booked as a lump sum, or a role that used to be classified as clinical support got reclassified as administrative after a title change. Cutting a budget line based on a classification artifact solves the wrong problem - and can create a real one.
Before treating any operating expense swing as a trend, check whether it's a timing issue, a reclassification, or an actual change in spending. That diagnostic habit - asking why before acting - is the CFO-thinking this section is meant to build.
Use Operational KPIs to Explain What Your P&L Can't
This is the core idea the rest of this guide is built around: a financial benchmark tells you whether a cost or margin is a fair price. An operational KPI tells you whether you're actually getting value for it.
Two practices can both sit at benchmark for clinical labor cost as a percentage of revenue. One is fully utilizing that labor - high billable hours, low cancellations, strong caseload fit. The other is paying the same market rate for staff who are frequently idle, waiting on authorizations, or covering canceled sessions.
The P&L alone won't tell you which practice you're running. Utilization, cancellation rate, average caseload per clinician, and authorization turnaround time will.
This is why the diagnostic sequence in this guide moves from the P&L outward to operational KPIs, rather than stopping at the financial statement.
The P&L tells you the result. The KPIs tell you whether that result reflects a pricing problem, a staffing problem, or an execution problem - and those require different fixes.
Check Your Budget vs. Actual Before You Panic
Before reacting to any of the gaps above, run one more check: how does the actual result compare to what you budgeted?
If your operational KPIs point to a real issue - utilization is down, cancellations are up, but your budget-vs-actual variance is close to zero, that's a different diagnosis than it looks like at first glance. It means the practice planned to land roughly where it did. That's still worth addressing, but it's a planning conversation, not an unexpected fire.
This isn't a section built to chase the generic "budget vs. actual" search term - that space is dominated by FP&A software vendors, and it overlaps with topics Flychain already covers in its budgeting and forecasting podcast for ABA practices.
Rather, "budget vs. actual for an ABA practice" specifically - accounting for cancellation seasonality, authorization renewal cycles, and staffing ramp timelines - is worth building into your monthly review, because it's the gut-check that tells you whether a number is a surprise or a plan playing out.
A Profitable ABA Practice Can Still Run Out of Cash
A practice can show a profitable P&L and still run low on cash. That gap usually comes down to four things: cash reserves relative to payroll burn, the cost of financing, accounts receivable trends, and the difference between debt repayment and reported profit.
Cash reserves vs. payroll burn.
Payroll is typically the largest and most inflexible cash outflow an ABA practice has. A useful cash-reserve target accounts for how many weeks of payroll and fixed costs the practice could cover if collections slowed down, not just what the P&L says about profitability that month.
Line-of-credit economics.
Every draw against a line of credit brings future cash forward at a cost. If the practice repeatedly borrows to cover ordinary payroll, the financing may be masking a structural cash-conversion problem rather than solving a timing issue. For general mechanics, SBA guidance describes how a line of credit lets a business draw funds as needed and generally pay interest only on the amount used-- a useful primer on how this type of financing works, separate from any specific product.
Merchant cash advances (MCA) are a different animal.
An MCA's factor rate isn't the same thing as an annual percentage rate or an annualized cost of borrowing. If you're comparing an MCA against a line of credit or another financing option, translate the factor rate into a comparable annualized measure and be explicit about the assumptions behind that conversion - repayment term and payment frequency both change the real cost significantly. For a product-specific calculation, use the actual financing agreement or a qualified financing source rather than a rule of thumb.
AR trend and debt repayment vs. reported profit.
A rising accounts receivable balance can make a P&L look profitable while cash is actually getting tighter, especially if a growing share of that AR sits in the rework cycle described earlier in this guide. And if the practice is paying down principal on debt, that repayment reduces cash without appearing as an expense on the P&L at all - part of why a practice can be profitable on paper and still feel cash-constrained.
Put This Into Practice
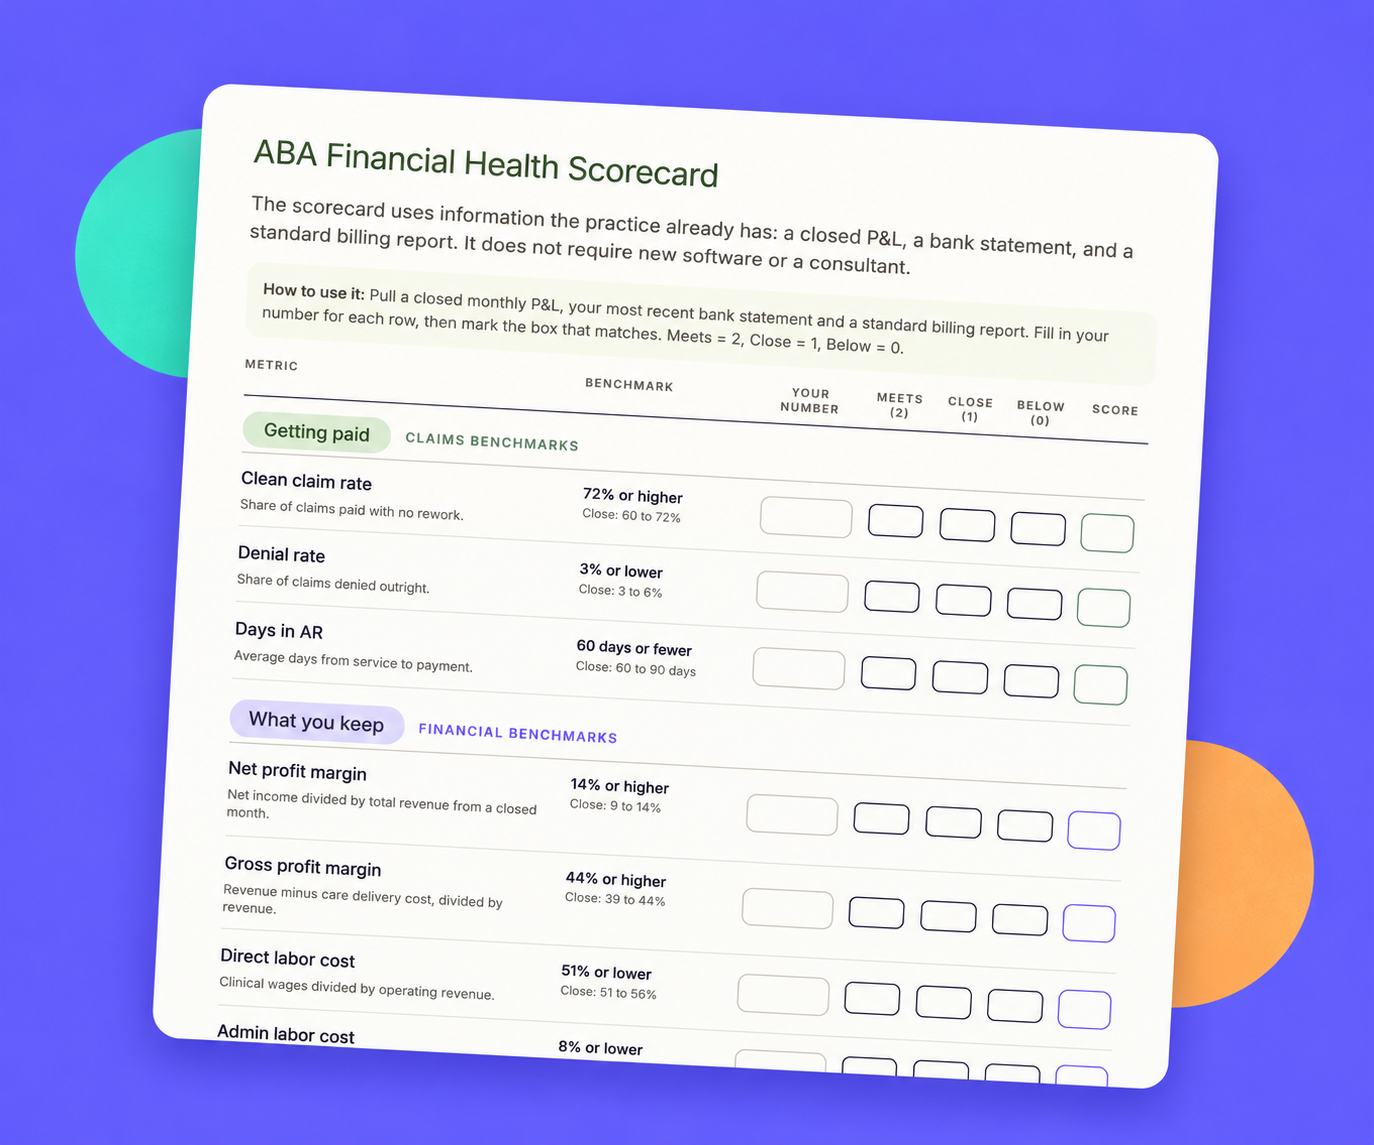
If you want a starting point for tracking these numbers every month, Flychain's Financial Health Scorecard is a free one-pager built around the KPIs covered in this guide so you can see where your practice stands before your next P&L review.
If you'd rather have someone walk through this diagnostic sequence with you every month, Flychain's Full-Service CFO for ABA practices pairs a hands-on CFO with monthly financial reports and ABA-specific KPI tracking, so the analysis in this guide happens automatically instead of manually.
And for the fuller picture, Flychain and Camber published a joint white paper covering all of the financial and operational benchmarks shared in the webinar this article is based on. This combines claims-level rework data with Flychain's financial benchmarks in one place.
Frequently Asked Questions About ABA Practice Financial Health
What is a healthy gross profit margin for an ABA practice, and what assumptions affect the benchmark?
There's no single number that applies to every practice — the right range depends on how consistently direct clinical costs are classified, practice size and maturity, payer mix, and reimbursement profile. Flychain's 2026 ABA Practice Financial Benchmark Report publishes a target range along with the methodology behind it; check that scope before comparing your own number against it.
What is a healthy net profit margin for an ABA practice, and how do accounting classifications affect the comparison?
Net margin benchmarks are similarly sensitive to classification — specifically, how a practice books administrative payroll, facilities costs, and any owner compensation. Two practices with identical operating profit can show different net margins purely because of how those categories are set up in their books, so treat any benchmark comparison as directional rather than exact.
What's the difference between gross margin and net margin?
Gross margin isolates direct clinical costs — BCBA, RBT, and BT pay — against revenue. Net margin subtracts every other operating cost as well. A gap between the two points you toward operating expenses as the area to review; both numbers moving together points you back toward the clinical delivery model.
How should an ABA practice determine an appropriate cash reserve for its payroll cycle, payer mix, and collection speed?
The right reserve depends on how many weeks of payroll and fixed costs the practice needs to cover if collections slow down, which in turn depends on payer mix (Medicaid FFS claims typically take longer and see more rework than commercial claims) and how quickly the practice historically collects on billed claims. There's no universal week-count that fits every practice — it's worth modeling against your own AR aging and payroll cycle rather than applying a generic rule of thumb.
Why would a profitable ABA practice still run out of cash?
Because the P&L doesn't show everything that affects cash. Debt principal repayment reduces cash without appearing as a P&L expense, a rising AR balance can make revenue look collected before it actually is, and financing costs like factor rates on merchant cash advances can be higher than they first appear. A practice can be profitable and cash-constrained at the same time.
What does "budget vs. actual" mean, and why does it matter for an ABA practice?
It's the comparison between what the practice planned to spend and earn for a period and what actually happened. For an ABA practice, it matters because it tells you whether a result you're seeing — like a dip in utilization — was already expected (a planning issue) or genuinely unexpected (an execution issue), which changes what you should do about it.
What's the difference between a financial benchmark and an operational KPI?
A financial benchmark tells you whether a cost or margin is priced fairly relative to other practices. An operational KPI — utilization, cancellation rate, caseload mix — tells you whether you're getting value for that cost. Both are necessary to fully explain a P&L result; neither one alone tells the full story.
Written be Ethan Schwarzbach, CEO and Co-Founder of Flychain