If you opened a P&L from your accountant this morning and you weren't sure whether your numbers were healthy, you're not alone.
Based on data across 350+ ABA practices we work with at Flychain, plus validation from industry experts: the six KPIs and benchmark targets in this report reflect what financial health looks like for ABA therapy practices in 2026.
Most BCBAs step into clinic ownership with deep clinical training and almost no formal financial training, and most accountants who work with ABA practices apply a generic small-business framework that hides the very things ABA owners need to see.
That's why ABA accounting requires its own playbook.
This 2026 ABA Practice Financial Benchmark Report distills the financial framework we share with ABA practice owners every day at Flychain.
You'll get the six KPIs every ABA owner should track monthly (or weekly), the target ranges that distinguish a healthy ABA practice from a struggling one, a diagnostic flow for figuring out what to fix when a number drifts off target, and a simple three-step plan to start tracking your numbers this month.
Whether you're navigating an aba practice startup or you already run a multi-site clinic, this report is built to be a practical, plug-and-play reference.
Flychain's healthcare-specific bookkeepers and CFO Hub deliver an ABA-ready P&L every month. Talk to our team for free.
Why ABA Accounting Isn't Normal Accounting
The first reason most ABA practice owners struggle to read their own financials is structural, not personal.
A generic accountant produces a P&L that lumps clinical wages and admin wages together, shows revenue as a single number, and ignores the cash-vs-profit gap that defines ABA.
ABA accounting reorganizes that same P&L so the metrics that actually run the business are visible at a glance.
Three things make ABA financially distinct from a typical small business:
- Revenue isn't one line. It's a portfolio. Most ABA practices bill Medicaid, one or more commercial payers (BCBS, Aetna, Cigna, United, etc.), and a small slice of self-pay. Each payer reimburses at different rates, denies for different reasons, and pays on different timelines. A single 'Revenue' line on a generic P&L hides every one of those dynamics.
- Labor splits are everything. BCBAs and RBTs are direct costs - they generate revenue. Schedulers, billers, and managers are admin costs. They enable revenue but don't produce it. Mix them on the same line, and your gross margin becomes meaningless. Separate them, and you can see whether your care delivery is efficient and whether your overhead is creeping.
- Profit and cash diverge in ABA more than almost any other small business. Medicaid can take 30 to 90 days to pay. Commercial payers can deny and reprocess. Your P&L can show a profitable month while your bank account is two weeks from a payroll crunch. ABA accounting tracks both - profit on the P&L, cash in the cash flow statement - and ties them together.
This is the core reason a generic chart of accounts fails ABA practice owners.
The deeper into your business those structural differences run, the more aggressively you need them reflected in how your books are organized.

Six ABA practice KPIs Every Owner Should Track
These are the six numbers we believe every ABA practice owner should be able to recall on demand.
Together, they cover profitability, cash, payer concentration, and labor efficiency - the four corners of ABA practice financial health. We'll walk through each one, including the formula, the benchmark, and how to read it.
If you're new to running a clinic, these ABA practice KPIs are your starting dashboard. If you've been running one for years, they're a sanity check against where your business actually stands.
KPI 1: Net Profit Margin
Formula: Net Income ÷ Revenue
Target: ≥ 10%
Net Profit Margin is the most familiar KPI but also the most commonly misunderstood. It tells you how much of every dollar of revenue you keep after every expense: clinical labor, admin labor, rent, software, taxes, everything.
Below 10% means you don't have margin to reinvest in your business, weather a payer disruption, or pay yourself fairly.
Healthy ABA practices in 2026 typically run between 10% and 18% net margin; anything materially higher is either exceptional or worth double-checking the books.
For a deeper look at how ABA practices sustain healthy margins on thin Medicaid reimbursement, see our podcast on thriving on thin margins: building sustainable ABA practices on Medicaid [link: https://www.flychain.us/learning-center/podcasts/thriving-on-thin-margins-building-sustainable-aba-practices-on-medicaid].
Industry Benchmark: Healthy ABA practices target a net profit margin of at least 10%, with most landing between 10–18%.
Key Takeaway: If your net margin is below 10%, start by checking gross margin to determine whether the issue is clinical cost, overhead cost, or revenue itself.
KPI 2: Gross Profit Margin
Formula: (Revenue − Direct Costs) ÷ Revenue
Target: ≥ 40%
Gross Profit Margin tells you how efficient your care delivery is, before any overhead is counted. Direct costs in ABA mean clinical wages - BCBAs, RBTs, clinical supervisors, therapy assistants, and direct-care staff (including overtime, drive time, and payroll taxes).
If your gross margin is below 40%, the issue is in care delivery: utilization, schedule density, RBT-to-BCBA ratios, or wage drift. If your gross margin is healthy but your net margin isn't, the issue is overhead, and you'll find it in admin labor or operating expenses, not in the clinical room.
Industry Benchmark: Healthy ABA practices target a gross profit margin of at least 40%, with strong operators reaching 45–50%.
Key Takeaway: Gross margin reflects both sides of the equation: revenue (contracted rates, payer mix, billable hour capture) and clinical cost efficiency (RBT utilization, scheduling density, BCBA supervision time). When it drops, check both before assuming the fix is operational.
KPI 3: Monthly Revenue by Payer
Formula: Payer Revenue ÷ Total Revenue × 100
Target: No single payer > 40% of revenue
ABA practices are exposed to payer concentration risk in a way most healthcare practices are not. State Medicaid programs change rates, prior authorization rules, and processing times with little notice.
If 60% of your revenue comes from one Medicaid program, your business absorbs all of that volatility with no buffer. The 40% rule isn't arbitrary - it's the threshold beyond which a single payer's policy change can put your business in crisis.
Track payer mix monthly and start building relationships with two or three additional payers before you need them.
And when you do open new payer contracts, rate negotiation matters. Use our ABA contracted rate analysis tool to benchmark your current rates against state medians before you sit down to negotiate.
Industry Benchmark: No single payer should exceed 40% of total revenue. Track payer mix monthly.
Key Takeaway: Payer concentration above 40% is the most common cause of catastrophic financial events in ABA. Start diversifying before you cross the threshold, not after.
KPI 4: Weekly Cash Balance
Formula: Total cash across all bank accounts ÷ Weekly payroll
Target: ≥ 2–3 payrolls of cash on hand
Profit is an opinion. Cash is a fact. ABA payers can take 30 to 90 days to pay; your staff cannot wait that long. Measuring cash in 'payrolls' rather than absolute dollars anchors the metric to your actual non-negotiable obligation.
One payroll covers a typical Medicaid delay. Two gives you breathing room. Three lets you negotiate, not panic, when a payer changes terms.
If you're routinely below two, you have a working capital problem before you have a profitability problem.
ABA cash flow shouldn't be a guessing game
Flychain's banking, bookkeeping, and CFO Hub products give ABA practice owners weekly visibility into cash, payer-level revenue, and labor cost ratios — the same metrics in this report, calculated automatically. Book a free 20-minute walkthrough.
Industry Benchmark: Healthy ABA practices keep 2–3 payrolls of cash on hand at all times.
Key Takeaway: Cash below 2 payrolls is a working-capital problem, not a profitability problem. Measure it weekly and treat it as the leading indicator it is.

KPI 5: Direct Labor Cost %
Formula: Clinical Wages ÷ Operating Revenue × 100
Target: ≤ 50% of revenue
Direct labor is your single largest expense line and your single largest controllable lever. 'Clinical wages' here means everyone who delivers care - BCBAs, RBTs, clinical supervisors, therapy assistants, including regular pay, overtime, drive time, and payroll taxes.
Above 50% of operating revenue, your gross margin compresses to the point that nothing you do on the admin side can save the business.
Above 55%, you're in trouble. Tracking this monthly is the single most important habit for an ABA owner - small drifts compound fast.
The deeper question behind the Direct Labor benchmark is workforce stability. For context on what it takes to build a stable ABA workforce, see our podcast on building a stable ABA workforce.
The single biggest controllable driver of direct labor cost percentage is turnover. Every RBT who leaves and waits 60–90 days to be replaced is open hours lost, waitlist clients unserved, and onboarding costs incurred - and most ABA owners have never put a dollar figure on what one turnover event actually costs them. Use our free ABA Cost of Turnover Calculator (built in partnership with ABA C.A.R.E.S.) to quantify your weekly lost revenue, waitlist revenue opportunity, and retention investment ceiling. Once you know what one vacancy costs, retention spend stops feeling like an expense and starts feeling like the obvious lever it is.
Industry Benchmark: Direct labor (clinical wages) should stay at or below 50% of operating revenue. Above 55%, the practice may be in trouble.
Key Takeaway: Direct labor is your largest controllable lever: utilization, schedule density, and turnover are where the percentage moves, not headline wage cuts.
KPI 6: Admin Labor Cost %
Formula: Admin Wages ÷ Operating Revenue × 100
Target: ≤ 18% of revenue
Admin labor is the overhead that quietly creeps as you scale. Practice administrators, office managers, schedulers, billing staff (whether internal or outsourced as RCM), HR, and marketing - anyone whose work supports but does not deliver care.
Healthy ABA practices keep this line under 18% of operating revenue. If admin labor is creeping toward 20% or higher, you're absorbing back-office cost faster than your top line is growing; usually because admin headcount was added as a workaround for a process or system problem instead of a true capacity problem.
The pattern of admin overhead creep is especially common in fast-scaling practices - for the operator perspective on this, see our podcast on the uncomfortable truths about scaling an ABA organization.
Industry Benchmark: Admin labor should stay at or below 18% of operating revenue.
Key Takeaway: Admin labor creep is silent. Review headcount and software stack quarterly, and scrutinize duplicate roles across multi-site organizations.

2026 ABA Financial Benchmark Targets At a Glance
Here's the full benchmark scorecard, in one place. Take this back to your accounting software and check yourself this month.
The targets below reflect what we see across healthy ABA practices in 2026 - not aspirational ceilings, just the floors of operational financial health.
The benchmarks in the table above reflect general targets for ABA therapy practices in 2026.
Specific targets vary by region, payer mix, practice stage, and ownership model. A newer ABA practice running its first six months will look different from a multi-site clinic in year five, but the directions of healthy versus unhealthy are the same.
The Diagnostic Flow: When a Number is Off, Where to Look First
Once you know your six numbers, the next skill is knowing where to look when something drifts off target. The single most useful diagnostic question is: if my net margin is below 10%, is it because of care delivery or overhead? Here's how to answer it in three steps
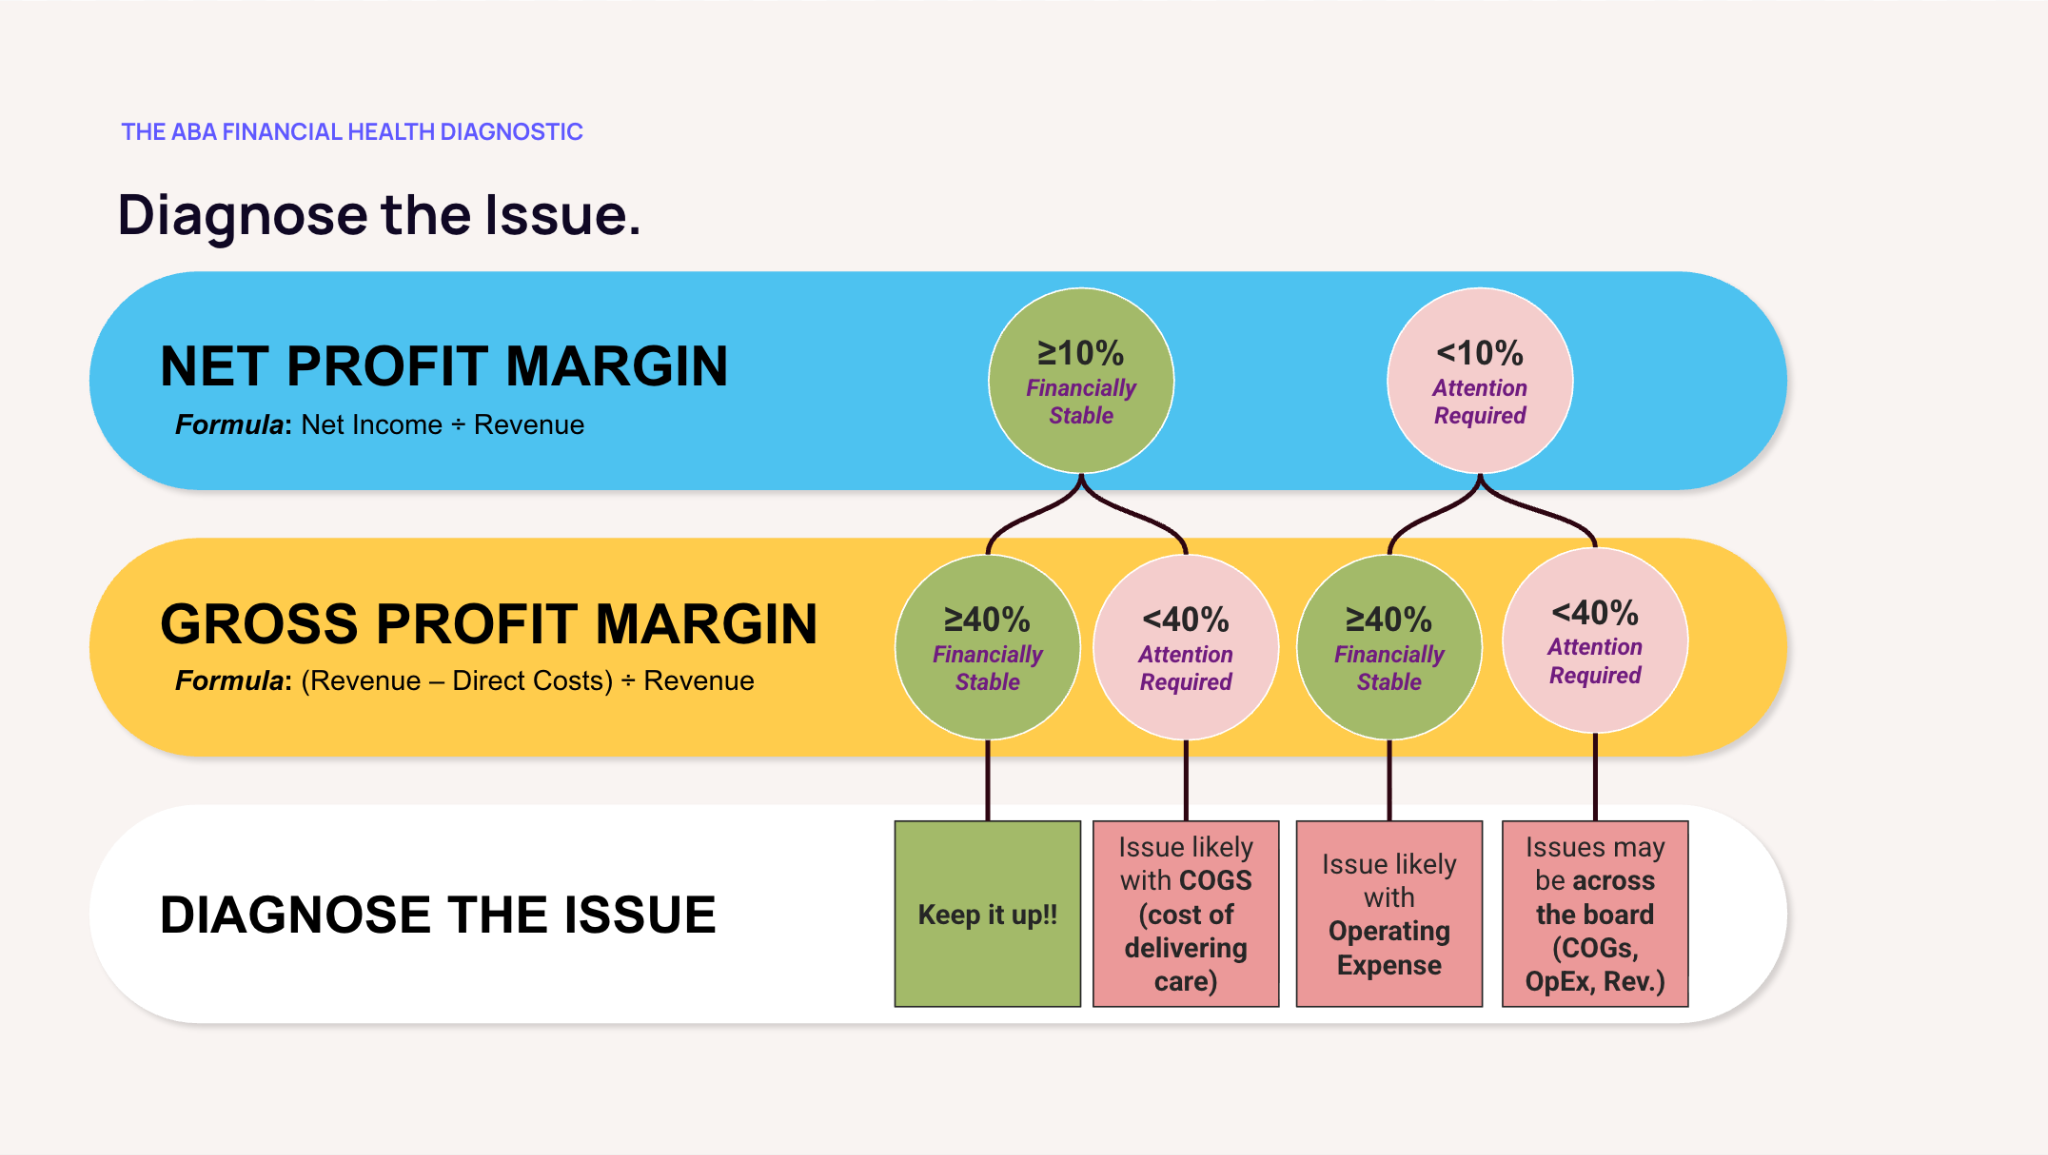
Step 1: Check Net Margin
If your Net Profit Margin is at or above 10%, you're financially stable for the month. Keep monitoring monthly and move on.
If it's below 10%, attention is required, and the next step is gross margin.
Step 2: Check Gross Margin
If your Gross Profit Margin is at or above 40% but your net margin is below 10%, the issue is overhead. Your care delivery is profitable, but admin labor and operating expenses are eating into the margin. Skip to Step 3 and focus on admin labor and opex.
If your Gross Profit Margin is below 40%, the issue is upstream and it's either a revenue problem or a clinical cost problem.
Check revenue first: are your contracted rates competitive with current market medians? Has your payer mix shifted toward lower-reimbursing payers? Are billable hours leaking through cancellations, no-shows, or unbilled supervision time?
If revenue checks out, the problem is in clinical operations: utilization, schedule density, the RBT-to-BCBA ratio, clinical wage drift, or unbillable time creep. Cutting admin headcount won't solve a gross margin problem.
The reason to check revenue first before clinical operations: revenue fixes (rate renegotiation, billing hygiene, payer mix shifts) are usually faster wins than clinical operations changes. Renegotiating one contract can move gross margin in 60 days; rebuilding utilization patterns takes a quarter or two.
Step 3: Take Action
If gross margin is low for revenue reasons, the action is contractual and operational, not clinical. Use the ABA Contracted Rate Analysis Tool to benchmark your rates against state medians, identify your two or three most under-priced contracts, and prioritize them for renegotiation. In parallel, audit your billing hygiene - cancellation rates, no-show patterns, and unbilled supervision time. A 60-day rate renegotiation can move gross margin more than a quarter of operational changes.
If gross margin is low for clinical cost reasons, audit RBT utilization, scheduling gaps, BCBA supervision time, and clinical wage trends. Run a clinical wage benchmark against your region and payer mix. The fix is in the schedule and the wage table, not in headcount.
If only the net margin is low (gross margin is healthy), audit admin headcount, software stack, rent, and salary benchmarks for non-clinical roles. The most common culprits are admin headcount creep that was never reversed after a process improvement, software duplication, and over-market salaries on non-clinical roles.
If direct labor is high, calculate your turnover impact before you cut wages or hire - most direct-labor problems are utilization or turnover problems, not pay problems.
Special Considerations for an ABA Practice Startup
If you're in the early stages of an ABA practice startup - pre-launch, or in the first 6 to 12 months of operation - these benchmarks still apply, but with three important caveats.
- Your first 90 days will look ugly. Payer credentialing, Medicaid enrollment, and the first wave of authorizations all take time. You'll likely be cash-negative until claims start paying out, often 60 to 90 days after first service. Plan for that gap with working capital, not by panicking when the early P&L looks bad.
- Set up a healthcare-specific chart of accounts from day one. If your bookkeeper sets up your books with clinical and admin wages on the same line, no metric in this report will be calculable without re-categorizing months of transactions later. Either restructure your chart of accounts now or work with a healthcare-specific bookkeeper who already has one.
- Track the six KPIs from month one, even if they're ugly. You can't track a trend without a baseline. Establishing your starting numbers, even if they're well outside the benchmark targets, is what lets you measure the slope of improvement. The owners who get to healthy benchmarks fastest are the ones who started measuring early.
New ABA practice owners often think, 'I'll set up real bookkeeping once we're profitable.' That order is exactly backwards. The bookkeeping setup is what lets you see the path to profitability. Without it, you're flying blind through the most volatile period of the business.
Three Steps to Start Tracking Your Numbers This Month
If you take one thing away from this report, take this: pick one month, calculate all six numbers, and write them down. That's it.
The hardest part of ABA accounting isn't the math. It's the habit of measuring monthly. Here's how to start.
1. Get clean books
If clinical and admin wages live on the same line in your accounting software, no metric in this report will work.
Either restructure your chart of accounts so clinical wages, admin wages, and operating expenses are on separate lines or find a healthcare-specific bookkeeper who already operates that way. This is a one-time setup that pays off forever.
2. Calculate today's six
Pull your most recent month's P&L. Compute all six KPIs. Don't worry yet about whether they're 'good'; just establish your starting point.
You can't track a trend without a baseline. Most owners are surprised by how different their actual numbers are from their gut estimate.
3. Set a monthly review
Block 30 minutes on the same day every month - first Monday after the books close works well - and compare your six numbers against the benchmarks.
Ask the diagnostic question: which number moved the most this month, and why? Over time, the answer to that question is what makes you financially fluent in your own business.
If you want a deeper walkthrough of how to structure ongoing financial planning for an ABA practice, listen to our podcast on financial planning for ABA practices [link: https://www.flychain.us/resources/podcast-financial-planning-for-aba-practices].
Frequently Asked Questions: ABA Accounting and Benchmarks
What is ABA accounting, and how is it different from regular small-business accounting?
ABA accounting is a healthcare-specific approach to bookkeeping and financial reporting for applied behavior analysis practices. Unlike a generic approach, it splits revenue by payer (Medicaid, commercial insurance, self-pay), separates clinical labor (BCBAs, RBTs) from administrative labor (schedulers, billers, managers), and produces a P&L that shows gross margin, payer concentration, and labor efficiency at a glance. Generic accounting collapses these distinctions into a single revenue line and a single wages line, thereby hiding the metrics ABA owners need to make operational decisions.
What is a healthy net profit margin for an ABA practice in 2026?
A healthy net profit margin for an ABA practice is at or above 10%. Most well-run ABA practices land between 10% and 18%. Below 10% means there isn't enough margin to reinvest in the business, weather a payer disruption, or pay the owner fairly. Significantly above 18% is unusual and worth verifying against the books. It can indicate excellent operations or a categorization issue.
What KPIs should every ABA practice owner track?
There are six aba practice kpis every owner should track: Net Profit Margin (≥10%), Gross Profit Margin (≥40%), Monthly Revenue by Payer (no payer >40%), Weekly Cash Balance (≥2–3 payrolls), Direct Labor Cost % (≤50% of revenue), and Admin Labor Cost % (≤18% of revenue).
Together, they cover profitability, liquidity, payer concentration, and labor efficiency - the four corners of ABA practice financial health.
How much cash should an ABA practice keep on hand?
ABA practices should keep at least two to three payrolls of cash on hand at all times, measured weekly. Measuring cash in payrolls rather than absolute dollars anchors the metric to your single largest non-negotiable obligation.
One payroll covers a typical Medicaid delay; two gives breathing room; three allows for negotiation rather than panic if a payer changes terms or processing slows.
How do new ABA clinic financials differ from established clinics?
A new ABA clinic will see ugly financials for the first 60 to 90 days while payer credentialing completes and the first wave of claims pays out. The same six benchmarks still apply, but new owners should expect to be below target for several months and focus on the slope of improvement rather than the absolute numbers.
The most important early move is setting up a healthcare-specific chart of accounts from day one - re-categorizing months of transactions later is far more painful than getting it right at the start.
What's the right ratio of direct labor to revenue in an ABA practice?
Direct labor (clinical wages: BCBAs, RBTs, clinical supervisors) should be at or below 50% of operating revenue.
Above 50%, gross margin compresses to the point where overhead control alone cannot rescue the business.
Tracking this monthly is the most important habit for an ABA owner - small drifts in utilization, overtime, or schedule density compound quickly.
How often should an ABA practice owner review their financials?
Five of the six KPIs in this report - Net Margin, Gross Margin, Revenue by Payer, Direct Labor %, and Admin Labor % - should be reviewed monthly, after the books close.
The sixth, Weekly Cash Balance, should be reviewed weekly, because payroll runs every one to two weeks, and a monthly check is too late to catch a cash crunch.
A 30-minute monthly review and a 5-minute weekly cash check are the minimum cadence for financial fluency.
From Numbers to Decisions
The thing we hear most often from BCBAs who become clinic owners is that the financial side felt like a different language at first. It isn't. Tracking these six numbers is the same skill as tracking treatment outcomes - defining the right metric, measuring it consistently, and using the data to make better decisions.
You already do that with patient outcomes. Now do it with your business.
If you're ready to put this report to work - calculating your own benchmarks against the 2026 targets, getting an ABA-ready P&L every month, and setting up the kind of ABA accounting that makes the numbers in this report visible at a glance - Flychain was built to do exactly that.
Flychain’s healthcare-specific bookkeepers, CFO Hub, and dashboards are designed for ABA practice owners who want to spend less time wrestling with their numbers and more time growing their clinic.
Get an ABA-ready P&L every month
Flychain delivers payer-level revenue, clinical-vs-admin labor splits, and full cash flow visibility. Book a 20-minute call to see your own numbers against the 2026 benchmarks.
Related Flychain Resources
• The 4 Pillars of a Thriving ABA Therapy Practice (podcast)
• Medical Billing Meets Accounting: Flychain & Camber Partnership for ABA
• Building a Stable ABA Workforce (podcast)
• ABA Cost of Turnover Calculator (free tool)
• ABA Contracted Rate Analysis Tool (free tool)
Written by The Flychain Team